json-server
How Developers Done It
Let’s assume you have created a git branch to work on an assigned feature. We will skip that and jump right into this topic of subtask development.
Your substask is to consume data return from some API calls. The returned data is in JSON format.
There are two separate code bases in this repo. JSON_SERVER and CHARTS.
The first is a simplified backend server and the second is a browser (client) app.
Often, engineering tasks are broken into subtasks. Each subtask should be small enough that the engineer can quickly setup an ecosystem for it.
This is a development senario where the engineer is tasked with developing the front-end, interfacing the chart.js library. She needs real-time sample datapoints for the charts.
All she needed is a few json files mirroring the backend APIs responses.
json-server is then used to simulate the backend. She now can focus on the frontend task.
JSON SERVER
The json-server provides mocked APIs data with complete CRUD operations.
Reference npm json-server Make sure you read to the end of the document to appreciate this development tool.
Run npm i json-server to install or update.
Setting up the backend
1. Create a directory JSON_SERVER
2. Create a file named air-quality.json
with content of a twenty-four hour datapoints.
{
"time": ["2023-03-11T00:00","2023-03-11T01:00","2023-03-11T02:00","2023-03-11T03:00","2023-03-11T04:00","2023-03-11T05:00","2023-03-11T06:00","2023-03-11T07:00","2023-03-11T08:00","2023-03-11T09:00","2023-03-11T10:00","2023-03-11T11:00","2023-03-11T12:00","2023-03-11T13:00","2023-03-11T14:00","2023-03-11T15:00","2023-03-11T16:00","2023-03-11T17:00","2023-03-11T18:00","2023-03-11T19:00","2023-03-11T20:00","2023-03-11T21:00","2023-03-11T22:00","2023-03-11T23:00"],
"pm10": [19.4,18.2,21.9,29.6,31.4,31.4,29.9,28.3,29.3,32,32.2,31.2,27.4,26.5,26.4,28,29.6,25.4,21.9,18.7,16.8,16.6,16.4,10.6],
"pm2_5": [12.8,12,14.8,20.2,21.5,21.5,20.6,19.5,20.3,22.3,22.4,21.6,18.8,18.2,18.2,19.3,20.4,17.2,14.6,12.4,11.1,11,11,7.1],
"carbon_monoxide":[194,260,353,459,499,523,543,557,565,564,547,519,352,363,379,383,362,328,279,243,205,164,145,132],
"nitrogen_dioxide":[17.7,33.7,56.4,79.8,84.6,83.3,80.6,80.8,81,80.1,77.8,74.6,49.1,47.8,46,42.7,39.5,35.7,30,24.5,18.4,12.2,9.8,8.8],
"sulphur_dioxide":[2.9,3.3,3.8,4.3,4.5,4.5,4.6,4.7,4.7,4.7,4.6,4.5,2.2,2.2,2.2,2.2,2.3,2.4,2.4,2.2,1.9,1.5,1.3,1.1],
"ozone":[79,59,30,1,0,0,0,0,0,0,0,1,10,9,8,9,13,19,28,36,46,55,57,56],
"aerosol_optical_depth":[0.11,0.11,0.11,0.12,0.13,0.14,0.12,0.11,0.11,0.11,0.11,0.11,0.09,0.1,0.11,0.11,0.11,0.11,0.12,0.14,0.13,0.11,0.09,0.09],
"dust":[0,0,0,0,0,0,0,0,0,0,0,0,0,0,0,0,0,0,0,0,0,0,0,0],
"uv_index":[0.55,0.25,0,0,0,0,0,0,0,0,0,0,0,0,0,0.05,0.2,0.6,1.1,1.25,1.15,1.3,1.85,1.05],
"uv_index_clear_sky":[1.2,0.3,0,0,0,0,0,0,0,0,0,0,0,0,0,0.15,0.75,1.95,3.5,4.8,5.45,5.1,3.95,2.45]
}
3. Create another file weather.json with content of a twenty-four hour of weather datapoints.
{
"time":["2023-03-14T00:00","2023-03-14T01:00","2023-03-14T02:00","2023-03-14T03:00","2023-03-14T04:00","2023-03-14T05:00","2023-03-14T06:00","2023-03-14T07:00","2023-03-14T08:00","2023-03-14T09:00","2023-03-14T10:00","2023-03-14T11:00","2023-03-14T12:00","2023-03-14T13:00","2023-03-14T14:00","2023-03-14T15:00","2023-03-14T16:00","2023-03-14T17:00","2023-03-14T18:00","2023-03-14T19:00","2023-03-14T20:00","2023-03-14T21:00","2023-03-14T22:00","2023-03-14T23:00"],
"temperature_2m":[57.4,57.5,56.7,56.9,56.6,56.3,56.2,55.8,55.7,55.9,57.3,60.3,61.9,62.6,62.7,60.9,58.4,55,53.4,52.2,51,49.7,48.7,48.5],
"apparent_temperature":[57.7,58.1,56.7,56.6,54.9,54.8,54.9,53.9,50.4,49.2,52.6,54.5,55.2,55.2,57.5,54.6,53.8,50.1,48.5,49,46.4,44.9,43.4,44],
"rain":[0,0,0,0.02,0.024,0.031,0.024,0.024,0.063,0.016,0.008,0.008,0.004,0,0,0,0,0,0,0,0],
"showers":[0.004,0,0,0,0,0,0,0.004,0,0,0.004,0,0,0.004,0.004,0.004,0.004,0.004,0,0.004,0,0.004],
"snow_depth":[0,0,0,0,0,0,0,0,0,0,0,0,0,0,0,0,0,0,0,0,0],
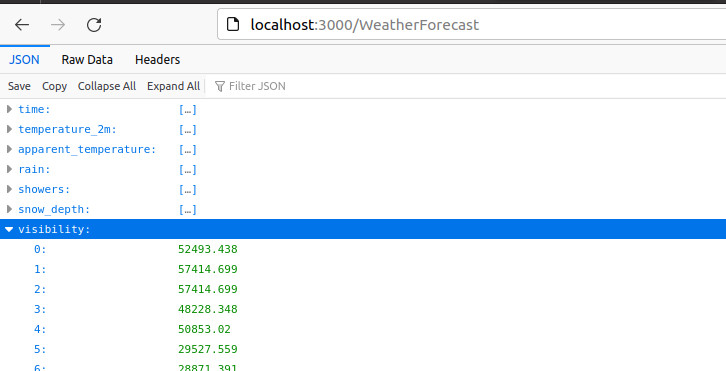
"visibility":[52493.438,57414.699,57414.699,48228.348,50853.02,29527.559,28871.391,34776.902,46259.844,50196.852,23622.047,54133.859,53805.773,54790.027,64632.547,64960.629,59383.203,50524.934,46916.012,44947.508,43635.172,43635.172,45931.758,50853.02]
}
Typically, we invoke json-server command to watch (--watch) a single json file.
json-server --watch db.json

 or

json-server --host 0.0.0.0 --port 9999 --watch plans.json
However, we could import multiple json files into an index.js
const airquality = require('./air-Quality.json');
const weather = require('./weather.json');

module.exports = () => ({
  AirQuality: airquality,
  WeatherForecast: weather
});
Next, invoke the json-server command as follow:
json-server --host 0.0.0.0 --watch index.js
Access the backend URI: http://localhost:3000
Frontend development
For simplicity, we will use the development server, parcel to test and build the frontend app.
1. Create directory CHARTS
2. Initialize javascript environment
npm init -y
npm install --save-dev parcel
3. Create the frontend index.html file
Interface chart.js (see reference).
For proof of concept, I cramped everything into index.html file.
For best practice, do not use synchronous XMLHttpRequest method in your production code. Also, split your scripts into separate file.
4. Run
npm run test

or

npm start
Output
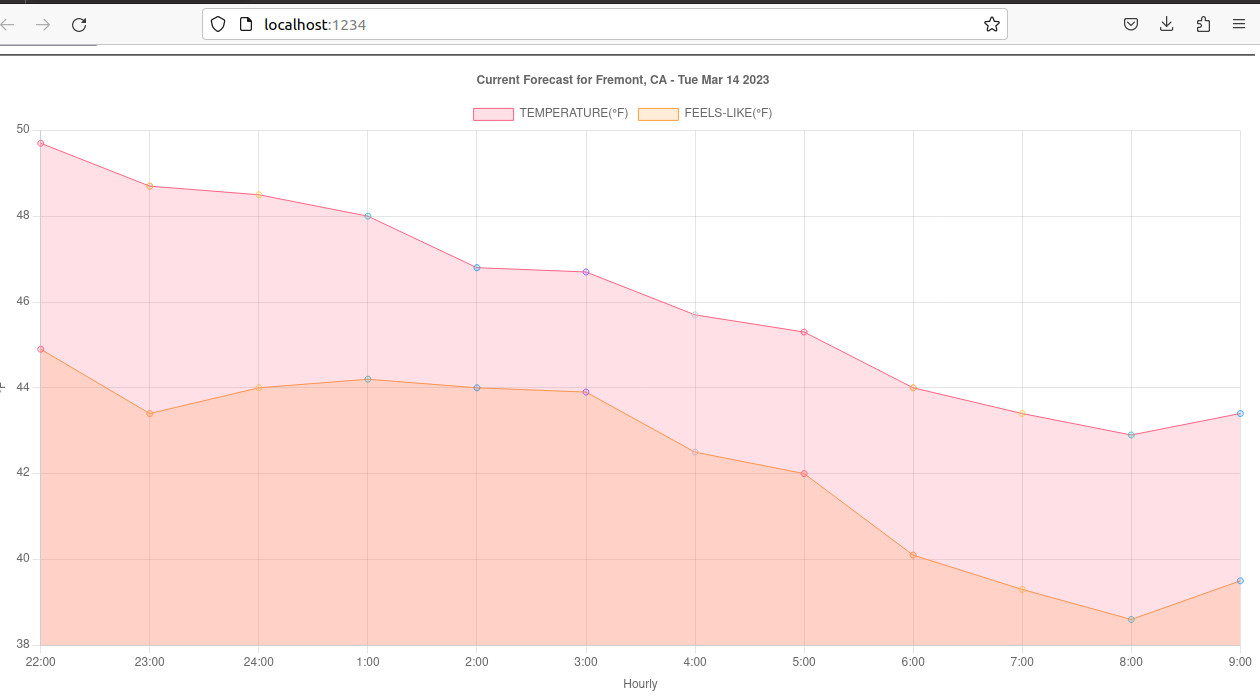
Conclusion
One of many tricks front-end engineers use to quickly accomplish subtasks is the use of simulated datapoints, easily produce with CRUD server json-server.
The only work remain is to configure the actual URIs when merging to code base.